

The term “cohort” can conjure up a myriad of concepts – some simple such as a military unit, and some negative such as politicians and their “cohorts”. So what is this new (beta) Cohort Report in Google Analytics?
Cohort Analysis Uses
To make the Google Analytics Cohort Analysis personal, let’s say we need insight into the following:
- Your content team wants validation on their editorial calendar to ensure fresh content, so they want to know when readers return to the site.
- The email team is setting up an email drip campaign and they want to know when they should engage users, so they want to know the biggest falloff dates to engage with promotions and new content.
- The CMO read an article that mentioned declining users versus bounce rate and wants to know how bad it is.
Isn’t Cohort Analysis Just A Visitor Date Report?
“Wait – don’t I already have the dates of when people visit my site?” you may ask. “It’s right there in the Frequency & Recency report, under Behavior.” That’s true, this report does show Days Since Last Session. But this report is, well, lacking…
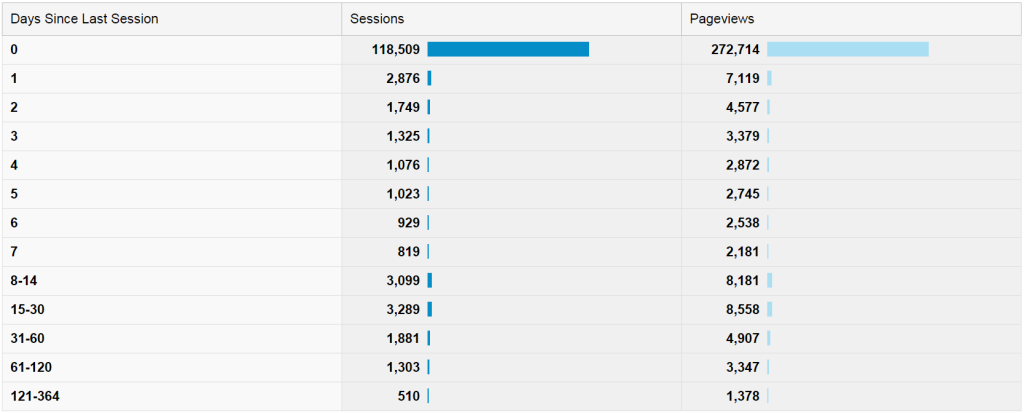
The fault of this report is that everyone is grouped into that one day count. If you looked at this report, you could comfortably tell your teams:
- There are declines after Day 1
- Days 6-7 visitors drop
- Visitors re-engage with us on day 8-14 (as a total, by the way)
- We lose visitors beyond 120 days.
You would be correct in all of those points. But looking at that report, we lost visibility into specific days, such as the date of the last campaign. Enter Google’s Cohort Analysis.
Observing Day Trends In Cohort Analysis
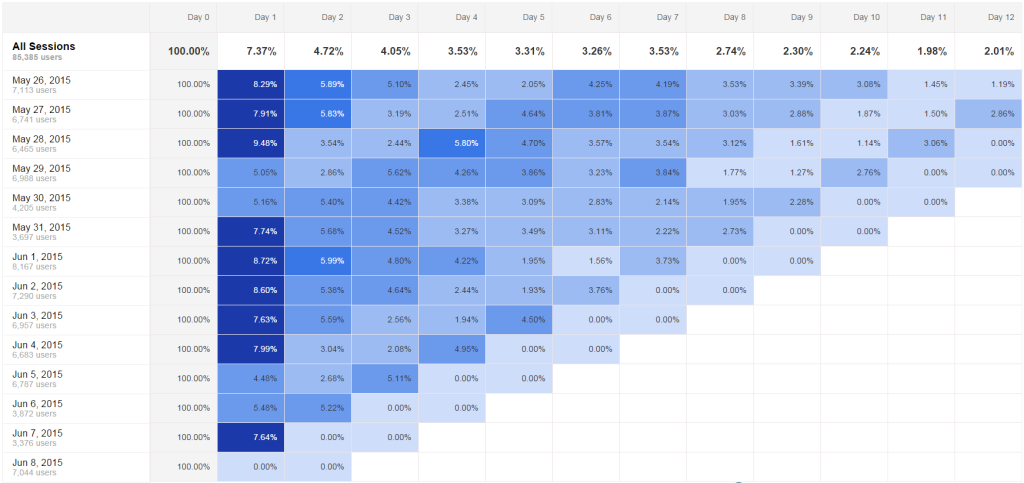
With our report on screen, it is immediately apparent that there are some gaps in our visibility. We can see that May 29-30 and June 5-6 have fewer visitors returning on Day 1. Since Day 1 is the day after our working day, we can interpret that:
- May 29 + Day 1 = May 30 (Saturday)
- May 30 + Day 1 = May 31 (Sunday)
- June 5 + Day 1 = June 6 (Saturday)
- June 6 + Day 1 = June 7 (Sunday)
Embracing our calendar, we can quickly observe that those are weekend days Saturday and Sunday. Interesting!
Our Quick Analysis
Overall, we can tell the content team that putting new content out on the weekend won’t has as much impact and would likely be sitting until Monday to be read. We can also tell the email team that users who last came to the site probably need a courtesy email on Day 2 and Day 11. Finally, we can tell our CMO that we have a good steady base of users and no real gaps (and that the content team and email team are already working to boost the user base!)
There are lots more things to observe – such as why May 28th, Day 4 had a larger-than-normal boost, and why day 4 lags on May 30th and 31st, but that’s a job for a different report. The objective here was solved, and we have new paths to investigate for bumps in traffic.
Got Any Tips?
How do you use Cohort Analysis? Got any tips you’d like to share and discuss? Leave a comment below!
Leave a Reply